
Report: Indonesia’s just energy transition partnership
The Indonesia Just Energy Transition Partnership (I-JETP) is a landmark climate finance agreement reached between Indonesia and a group of…

Climate change is driving an increase in the frequency and magnitude of extreme climate events around the world. The expected economic impact of climate disasters could reach 18% of global GDP by 2050 if there is limited action to reduce global emissions. In China, a substantial increase in heavy summer precipitation in the southeastern regions and persistent spring-summer heatwaves have been attributed to human-induced climate change. China’s future economy is vulnerable to both extreme dry and heavy precipitation weather events and is at risk of losing between between 6.6% and 23.5% (cumulatively) of its GDP by 2048 in a <2°C and >3°C world, respectively. These estimates by the global reinsurer SwissRe represent the best and worst-case climate scenarios – the mid-case scenario for a world of 2.6ºC warming was a cumulative GDP loss of 18.1%. This brief summarises some of the key climate risks for the Chinese manufacturing industry based on reviewing over a hundred of the most recent scientific studies.
Flooding is the biggest driver of average annual losses from disaster and the majority of China’s provinces are already at high flood risk. The 2021 summer floods in Zhengzhou have already caused 51 deaths and USD 10 billion worth of direct damages in the region alone. Between 1996-2015, China experienced USD 214 billion in production losses. Case studies show that once indirect costs are considered, the economic cost of flooding events tends to double.
Extreme rainfall, a key indicator of future flood risks, is expected to increase in both intensity and duration if we cannot keep global warming levels to 1.5ºC. Particularly affected are China’s eastern and coastal regions of Jiangsu and Zhejiang, which are among China’s most populous and economically powerful provinces. This region is the engine of the Chinese economy and the world’s electrical manufacturing hub, producing over 90% of the world’s personal computers, 80% of the world’s air conditioners, and 70% of the world’s mobile phones in 2014. It also produces 60% of the world’s cement and 45% of global shipping vessels. The fact that most of these manufacturing sites are located in areas that are prone to flooding events of significant magnitude (see figure 1 below), indicate that any climate-induced disruption to business operations is likely to have global supply-chain implications.
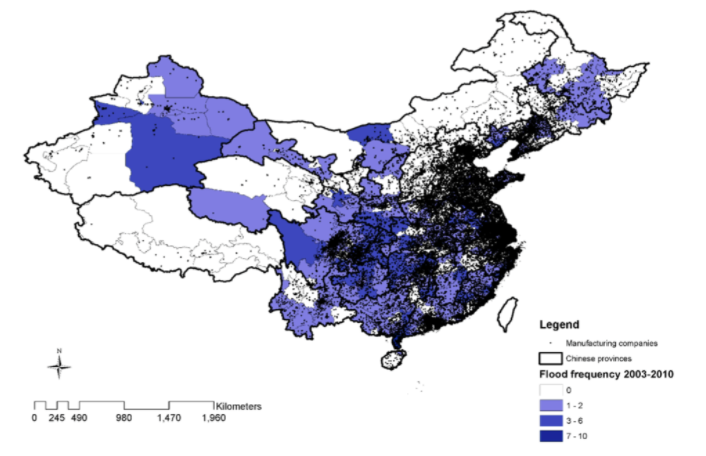
Figure 1:This figure maps the locations of major reported flooding events at the city level between 2003 and 2010 and manufacturing companies in China. Black dots indicate the manufacturing facilities. Source: Multi-Scale Assessment of the Economic Impacts of Flooding: Evidence from Firm to Macro-Level Analysis in the Chinese Manufacturing Sector. Data source: Dartmouth Flood Observatory (2016) and ORBIS (2017).
An increase in the frequency and intensity of heatwaves is expected to continue under all future climate scenarios, to differing degrees of severity. The southeastern manufacturing regions of Guangdong, Jiangsu and Zhejiang are most at risk (see figure 2 below). For example, the Lancet estimated that Chinese workers had potential heat-related productivity losses of an estimated 9·9 billion hours in 2019, 0·5% of the total national work hours for that year. Events like eastern China’s historically hottest summer in 2013, which resulted in dozens of deaths and crop damages of approximately USD 10 billion, is projected to become the norm under 1.5°C global warming. Under 2°C global warming, each year’s heatwave would be worse than the most severe in the current climate. Heat and heatwave exposure can often be fatal to older populations and outdoor workers. In its extreme form, heatwaves can result in excess mortality, usually seen in the exacerbation of cardiovascular and respiratory diseases. A particularly serious future heatwave threat has been projected in the area of the North China Plain, where climate change is expected to interact with local irrigation practices to result in heatwaves that will present severe risk for labourers working outdoors.
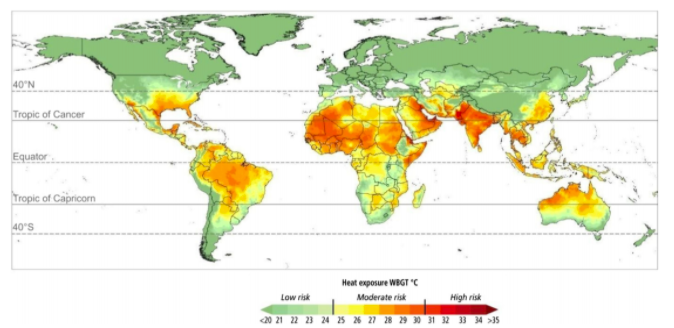
Figure 2: This figure illustrates the average of daily WBGTmax during the locally hottest month in 67,420 grid cells, 30-year mean 1981–2010, CRU data (Similar map was published in the IPCC report, Smith et al. 2014). Source: Estimating population heat exposure and impacts on working people in conjunction with climate change
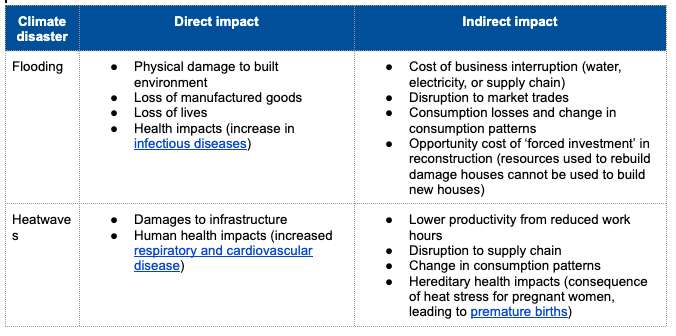
Large-scale disasters such as extreme heat and flooding cause both direct and indirect economic losses. Direct losses are the immediate impact of the physical disaster, and are typically differentiated between market losses (loss of goods and services where price can be easily observed) and non-market losses (losses that cannot be repaired or replaced, such as a loss of lives). Indirect losses include all losses that are not caused by the disaster itself, but by its consequences over longer periods of time. Trade and commerce across China is more interconnected than ever before, which means that local production and labour productivity losses after a climate disaster can create knock-on effects far beyond a city or region, exacerbating the initial economic losses. As production processes become more reliant on Just-in-Time logistics and supply chains, any momentary and unexpected delays to production are also likely to amplify impacts upstream and downstream of the business. Table 1 below illustrates some of the direct and indirect costs of a climate-driven disaster event.
Source: The World Bank.
Direct flood damages are typically assessed by linking physical properties of the hazard (such as flood depth and areas of vulnerability) with the location of assets or land-use type. However, there are new economic studies that expand on this approach in assessing indirect economic damages that include:
Due to the expanded geographic and temporal scope of indirect impacts, indirect losses can be high and often exceed direct damages.
Near-future projections that take into account international trade flows indicate that China will suffer one of the world’s largest economic losses from river floods, totaling USD 479 billion by 2035.
In the longer term, once indirect damages and future socio-economic projects are considered, a study has demonstrated that under a 4°C warming scenario, river flooding could cost up to USD 385 billion a year by the end of the century. Out of this total cost, USD 129 billion is the direct costs of flooding and USD 256 billion the indirect costs (see figure 3 below). Under a <1.5°C scenario, the cost could be USD 93 billion.
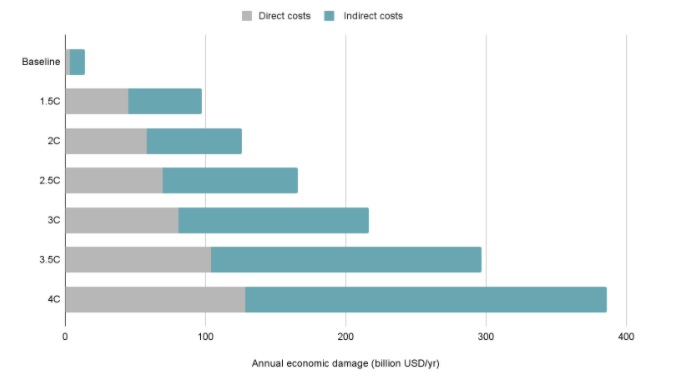
Figure 3: China’s average annual direct and indirect fluvial flood damages calculated across the 30-year time period for the baseline and six warming scenarios. Projected changes in average annual economic damages for the future period (2086–2115) are compared to the baseline period (1961–1990). Source: Assessing the economic impacts of future fluvial flooding in six countries under climate change and socio-economic development.
This study illustrated that indirect losses can be significantly larger than direct losses as they accumulate over time. In other words, indirect flood damages do not only result in a short-term impact on economic output, but have the potential to restrict longer-term economic growth. The study found that the indirect annual economic damage of floods alone could put nearly 2.5% of China’s national annual GDP at risk by the end of the century.

Figure 4: China’s average annual indirect economic damage as a share of national GDP (%) (model ensemble average) caused by river flooding under the baseline and future scenarios with climate change and socio-economic development. Source: Assessing the economic impacts of future fluvial flooding in six countries under climate change and socio-economic development.
Indirect losses in the manufacturing sector can be particularly high as manufacturing companies usually have complex supply chains and provide essential inputs into the production processes of other economic sectors. A study of manufacturing firms in China found that, on average, flooding reduced output by 28.3% a year between 2003-2010. The indirect impacts of flood events on stock level and trading continued for two years after the initial flooding event, resulting in GDP losses of up to 2.3% to the Chinese economy over the period. These losses are likely to increase over time as incidents of flooding increase due to climate change.
Heatwaves differ from floods as a climate disaster as they are more persistent and less likely to cause physical damage to goods and services. The direct economic impacts of extreme heat events tend to arise from its substantial harm to human health and, therefore, its indirect impacts can extend to disruption of labour and economic productivity. For example, economists often equate each heat-induced death to a full year of lost working days for one person. Cardiovascular admissions and respiratory admissions to the hospital also result in lost working days for labourers and workers.
In the future, China’s key manufacturing regions could lose up to 2.04% of their working capacity due to heat impacts under a >3°C scenario, in comparison to 0.91% under <2°C scenario (see figure 5 below). Some papers also hypothesize that apart from the productive time lost as a result of heat-induced health complications, which is termed “absenteeism”, excess heat can also result in “presenteeism”, which refers to the reduction in work productivity and work capacity. It has been demonstrated that extended periods of exposure to high temperatures can cause mental distractions, such as concentration lapses, poor decision making and reduced cognitive performance.
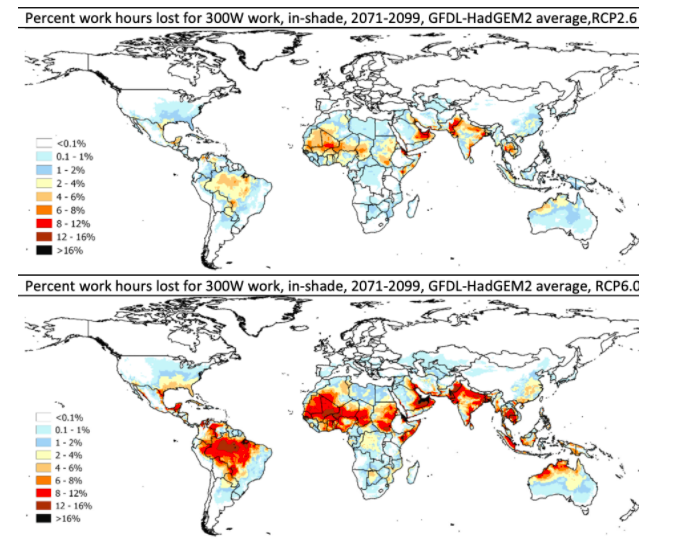
Figure 5: The percentage of annual daylight in-shade work hours lost for workers in moderate intensity jobs (MR = 300 W) in each grid cell in 2071–2099 as a result of climate change (GFDL-HadGEM2 midpoint/average, RCP2.6 and RCP6.0). Source: Estimating population heat exposure and impacts on working people in conjunction with climate change
The scale to which China can adapt to individual climate disasters at its point of origin will be critical to limiting its direct and indirect economic losses. However, the adaptive capacity of companies and governments is not unlimited:
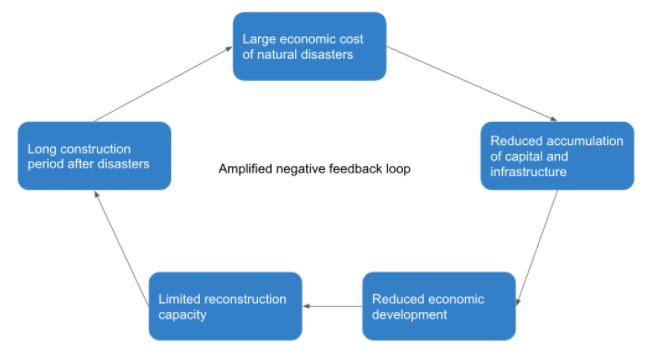
Figure 6: Amplified negative feedback loop. Source: The World Bank.

The Indonesia Just Energy Transition Partnership (I-JETP) is a landmark climate finance agreement reached between Indonesia and a group of…

Key points: The International Monetary Fund (IMF) and the Multilateral Development Banks (MDBs) play a crucial role in providing climate…