
Bullish Asian gas demand forecasts eroded by renewable surge
Increased momentum in the energy transition has led the IEA to reduce its gas demand forecast for 2040 by 1,500…
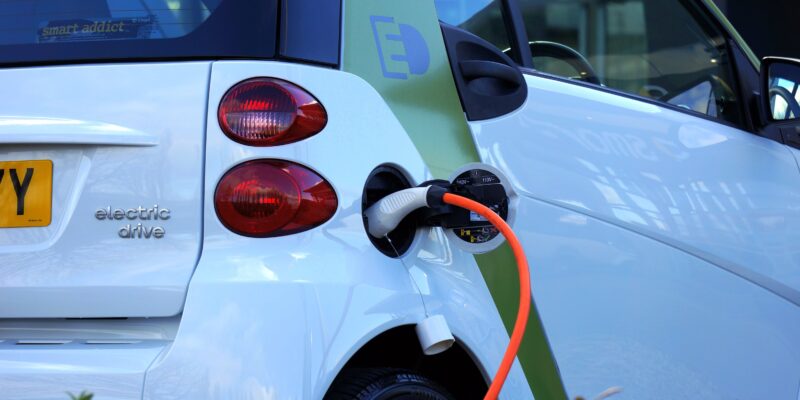
Electric vehicles (EVs) are one of the fastest growing technologies in the energy transition. EV sales surged to around 18% of global vehicle sales in 2023 from 2.6% in 2019. Remarkably, supply chains have kept up with soaring demand. The market is likely to continue growing, and EVs could reach price parity with fossil fuel cars as early as 2024 in Europe.
The Organisation of Petroleum Exporting Countries (OPEC), a coalition of 13 major oil exporters, controls around 30% of global oil supply, 60% of global petroleum trade and 80% of global crude oil reserves. OPEC holds regular meetings to decide how much oil to supply to the global market, and these decisions influence oil prices due to its large market share. If OPEC member countries decide to reduce the supply of oil below demand, oil prices tend to rise. If supply exceeds demand, then prices tend to fall.
In its annual forecasts, OPEC predicts a much slower transition to EVs compared to other forecasters, such as the International Energy Agency (IEA) and Bloomberg New Energy Finance (BNEF). Our analysis finds that OPEC’s historical record of forecasting EV fleets is the worst amongst major forecasters, raising doubts over the credibility of its future predictions.
BEVs are powered exclusively by an electric motor, which is powered by a battery. BEVs are also described as pure electric vehicles, only-electric vehicles, fully electric vehicles or all-electric vehicles.
A vehicle that is powered by both an internal combustion engine (ICE) and an electric motor. The battery in a PHEV is charged by connecting to a power supply, unlike a standard hybrid, where the battery is charged by the ICE and regenerative braking. The advantage of a PHEV is that it can be driven purely in electric mode for much longer distances compared to a standard hybrid.
FCVs use a hydrogen fuel cell, which takes purified air and hydrogen fuel (stored at high pressure in tanks in the vehicle), to produce electricity and water through a chemical reaction. A battery is used when extra power is needed.
Each forecaster defines EVs using various combinations of the three types:
In 2022, BEVs accounted for 71.8% of the vehicle market, while PHEVs accounted for 28% and FCVs stood at 0.2%. How EVs are defined has a significant bearing on each forecaster’s estimates.
This report will use two approaches to compare forecast accuracy for the global EV fleet:
Figure 1 shows how forecasts for OPEC, the IEA and BNEF in 2018 predicted global EV fleet size over the following four years.[1]IEA’s base-case Stated Policies Scenario for 2020-2022 replaced the New Policies Scenario used for 2018-2019. OPEC estimates were used for 2018-2019 due to a lack of published data. Estimates were … Continue reading Between 2018 and 2022, BNEF was the most accurate forecaster, and OPEC was the least accurate forecaster, falling far behind its competitors. The average percentage error for each forecaster across the four years was +14% for the IEA, -11% for BNEF and -40% for OPEC.
Figure 2 shows forecasters’ EV fleet predictions for 2022 against the actual fleet size, over the period 2015-2021.[2]In the IEA’s 2020 World Energy Outlook, data was not available for its forecasted value of 2022, so we did not include this in our calculations. 2022 IEA values for the forecast year 2018 and 2019 … Continue reading OPEC’s predictions for the global EV fleet size in 2022 were the least accurate every year between 2015 and 2021, with an average deviation of -59%. Despite improving the accuracy of its forecasts over time, OPEC did this at a slower pace than the IEA or BNEF. In 2015, OPEC’s forecast for 2022 was off by -90%. Although it subsequently revised its forecasts upwards, a gap persisted, and in 2018 and 2019 it was off the mark by -49%. The gap slightly worsened in 2020 to -50% and in 2021, when OPEC was forecasting just one year ahead, the -49% gap remained.
Meanwhile, both the IEA and BNEF consistently revised their outlooks year on year, demonstrating much higher accuracy. The IEA was out by -67% in its 2016 forecast of the 2022 EV fleet size, but narrowed this gap to just -9% in 2021.
Mapping OPEC’s EV forecasts to reality, all eight outlooks underestimate EV fleet size. In its 2015 forecast, its estimate for 2020 fell short by over 8 million EVs. Although its estimates have crept up and become more accurate each year, the discrepancy with real numbers is still significant. Growth of the global EV fleet is likely to continue to exceed OPEC’s expectations.
Considering the historical record of these forecasters, the 2023 projections from the IEA and BNEF for the future size of the EV fleet will likely be more accurate than OPEC’s. Even as OPEC and oil majors such as BP and Exxon have recognised the rapid uptake of EVs and lifted their fleet predictions, they are still not nearly as accurate as that of the IEA and BNEF. Figure 4 shows the latest forecasts from the IEA, BNEF, BP, Exxon and OPEC. The IEA and BNEF predict a significantly larger EV fleet in 2040 than OPEC and other oil majors.[3]The 2040 data point for the IEA was taken from its New Momentum Scenario.
BNEF’s projected EV fleet for 2040 is expected to displace over 20 million barrels per day (bpd) of oil demand (Figure 4), surpassing the average daily oil consumption of the US in 2022.[4]The Economic Transition Scenario for BNEF models a market-led energy transition that assumes no policy changes. EV growth increases the threat of oil demand falling in the coming decades, as more vehicles rely on electricity instead of gasoline or diesel fuel, posing a risk for OPEC countries which have 80% of the world’s crude oil reserves.
Oil demand is forecast to peak by the end of the decade, according to the IEA, and falling EV prices suggest EVs are already displacing some oil demand. The IEA has revised down its oil demand growth forecast for 2024 to 880,000 bpd, whilst OPEC has stuck to its original forecast of 2.25 million bpd. The difference is equivalent to over 1% of daily world oil use. Historically, OPEC has been critical of the IEA’s accuracy in forecasting the energy transition, but our data suggests that OPEC forecasts are fraught with inaccuracies.
In its 2023 outlook, OPEC forecasts the number of ICE vehicles will continue to rise up to 2045, reaching 72% of the global vehicle fleet. It states that “this large number of ICE-based vehicles will provide a solid base for the sustained use of oil in this sector”. The inaccuracies in its EV forecasts raise doubts over the reliability of this claim.
Although EV sales are still booming, the exact pace of future uptake remains uncertain. With price competition intensifying in the market, EV technology rapidly improving, and more stringent emissions rules being imposed across the world, there are many moving parts and complex methodology questions to consider when predicting future EV adoption.
However, one certainty is the track record of EV forecasters. The data shows that OPEC’s forecasts on EV uptake have consistently failed to provide an accurate prediction of the future, even for just one or two years ahead. The IEA and BNEF have consistently produced much more accurate forecasts compared to OPEC over the same time period. Policymakers and journalists should consider the track record of these forecasters to gauge their credibility as reliable guides to the future.
References
| ↑1 | IEA’s base-case Stated Policies Scenario for 2020-2022 replaced the New Policies Scenario used for 2018-2019. OPEC estimates were used for 2018-2019 due to a lack of published data. Estimates were calculated by multiplying OPEC’s global outlook for the total number of vehicles with its share of EV penetration in 2018 and 2019. EV penetration data was extracted using WebPlotDigitizer which produces estimated data based on published graphs. The OPEC 2018 estimate is the same as BNEF’s estimate for OPEC’s EV fleet predictions that year. The reference period, 2018-2022, reflects the earliest year for which OPEC’s EV forecasts are readily accessible (2018), and the most recent year for which we have full-year actual data (2022). |
|---|---|
| ↑2 | In the IEA’s 2020 World Energy Outlook, data was not available for its forecasted value of 2022, so we did not include this in our calculations. 2022 IEA values for the forecast year 2018 and 2019 were also not available, but have been estimated by BNEF. In 2015, IEA and BNEF EV fleet forecast data was not available. |
| ↑3 | The 2040 data point for the IEA was taken from its New Momentum Scenario. |
| ↑4 | The Economic Transition Scenario for BNEF models a market-led energy transition that assumes no policy changes. |

Increased momentum in the energy transition has led the IEA to reduce its gas demand forecast for 2040 by 1,500…

Azerbaijan's climate and renewable energy efforts are dwarfed by its gas export expansion plans.