
Azerbaijan’s energy and climate policies dominated by gas export expansion plans
Azerbaijan's climate and renewable energy efforts are dwarfed by its gas export expansion plans.
In 2022, there was 91 MW of offshore wind in Japan, 5 MW of which was floating offshore wind. These small scale demonstration projects are expected to deliver valuable technical lessons for the offshore wind industry in Japan. This capacity increased in February 2023 when the country’s first large-scale offshore wind project (140MW) began commercial operation at Noshiro Port in Akita Prefecture.
While this is a low level of deployment compared with some other countries, the government has increased its commitment to the technology and increased targets for awarding contracts for offshore wind energy to 10 GW by 2030 and 45 GW by 2040. The aim is to construct 1 GW a year between now and 2030. However, reaching the 2030 target will be challenging given that offshore wind projects can take several years to develop and construct – the IEA expects that only 0.5GW of new capacity is likely to be commissioned between 2022 and 2027 in total, meaning that the additional 9.5GW will have to be delivered in the three years between 2027 and 2030.
Japan is currently running a tender for contracts to lease the rights to generate electricity from offshore wind. [1]Tenders (or auctions) are competitive bidding processes for fixed-price contracts for a plant’s output. Developers submit bids for the price they would like to receive for output, and the … Continue reading The auction covers four sites that are expected to deliver 1.8 GW of new offshore wind capacity. Bids for contracts are due by the end of June 2023, and the results of the auction are expected from the end of 2023 to April 2024.
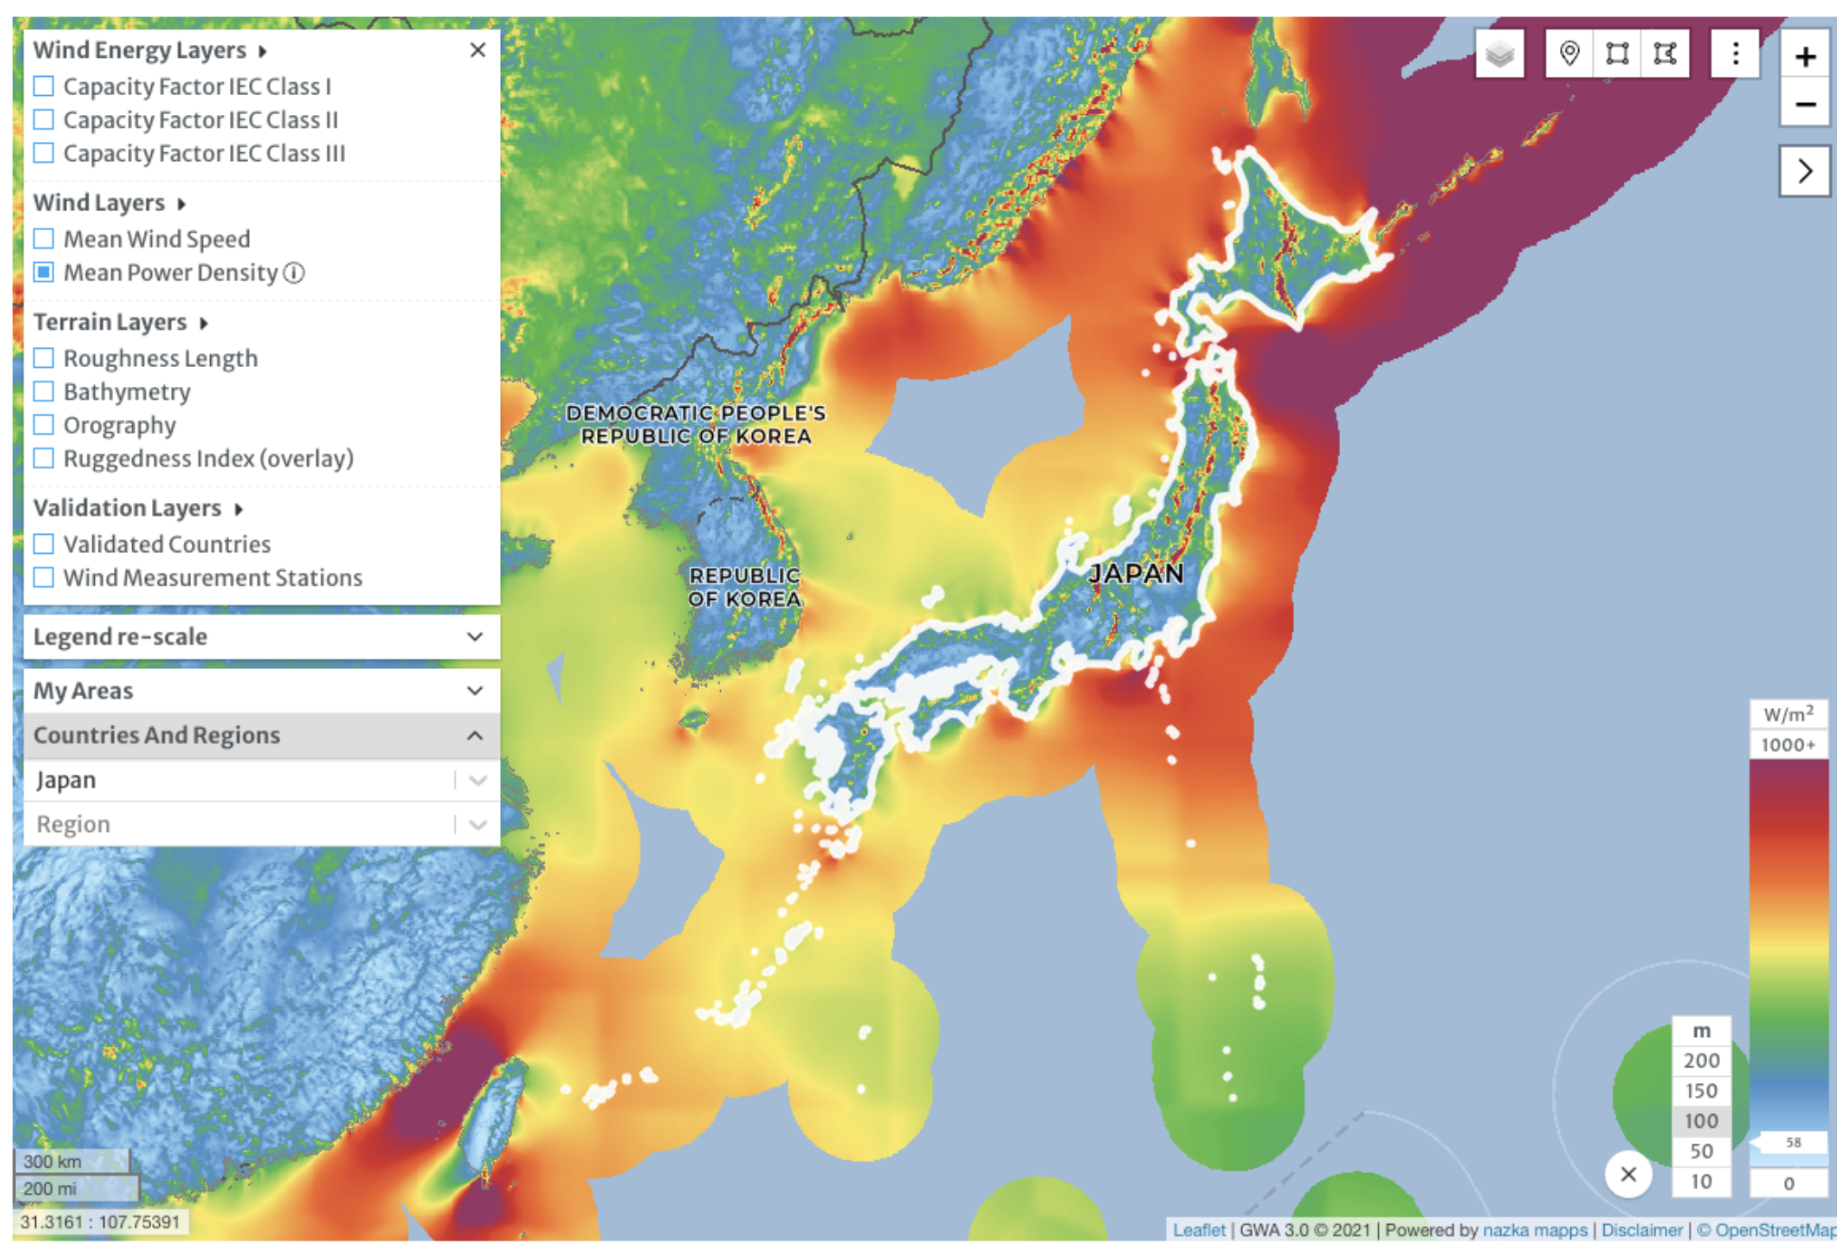
Japan has considerable wind resources offshore, particularly in the north of the country (see Fig. 1), with most of the potential in deeper waters further offshore. The Global Wind Energy Council (GWEC) estimates there is potential for around 128 GW capacity for fixed bottom projects in shallow waters, and 424 GW for floating offshore wind in deeper waters.
Given this large resource, the IEA estimates that Japan’s total technical potential for offshore wind generation is over 9,000 TWh/year.[3]Technical potential is the achievable energy production of a given technology in the context of topographic, environmental and land use constraints. It does not take into account the costs of … Continue reading This is more than nine times its projected electricity demand in 2050 (922 TWh/yr). Offshore wind farms in shallow water could generate around 40 TWh/year of this, with the rest coming from wind farms sited further offshore, including floating offshore wind installations (see Box 1).
Floating offshore wind uses floating foundations for the base of turbines, unlike the more traditional fixed base turbines. There are three main types: spar-buoys, semi-submersible/barge and tension leg platforms. There are also variants of these three approaches.
They are being developed for use in deeper water (60-2,000 metres) where it would be too expensive to build traditional fixed-bottom turbines. The designs build on expertise developed in the offshore oil and gas sectors.
There are a number of small demonstration projects already in place or in development, including in Scotland (Hywind and Kincardine), Portugal, Norway and France, as well as Japan (Nagasaki-Goto and Kitakyushu). The industry is using the experience of building and operating these projects to bring down costs, establish supply chains and move towards mass production of components. GWEC expects the technology to be fully commercialised by around 2030.
Because the projects are sited further offshore, they can make use of stronger, more consistent winds, meaning that they can operate more efficiently. They can also reduce public opposition to new projects. Projects also require less material resources than more conventional fixed-bottom turbines, and installation causes less environmental disruption to install.
The floating offshore wind industry is considered to be in its pre-commercial phase, and ready to scale up with commercial-scale, cost-effective projects ready for installation as early as 2025.
Japan is reportedly considering extending offshore wind construction beyond its territorial waters (22 km from the coast) into its Exclusive Economic Zone (EEZ) (around 370 km from the coast). This approach will allow Japan to access more of its offshore wind resources, particularly if it implements floating offshore wind turbines. Developing offshore wind farms in EEZs has already taken place in Europe and has allowed the Netherlands, the UK and Belgium to access more sites for their offshore wind farms.
Offshore wind plants operate more efficiently than onshore wind plants. This reliability means the IEA classifies offshore wind as a ‘variable baseload’ technology that can contribute to the security and reliability of electricity systems.[4]Baseload is the minimum amount of constant power required over a period of time. Offshore wind projects in Japan currently have a capacity factor (the ratio of the actual electricity generated to the theoretical maximum amount that the plant could generate) of 35%-45%, and the IEA expects this to increase by an additional 5% by 2040 as a result of taller turbines with larger rotors. A capacity factor of 40% compares favourably with the current performance of Japan’s nuclear reactor fleet (around 15.5%), though it is less than coal (64%) and gas (47%).
Siting turbines further offshore is also projected to lead to significant additional improvements in capacity factors as a result of higher, more constant wind speeds. Sea surface winds at around 10 km offshore are 25% higher than winds onshore.
Fixed-bottom offshore wind is increasingly seen as a mature technology that competes with new fossil fuel generation thanks to established supply chains and very rapid reductions in the cost of building and operating projects. The global weighted Levelised Cost of Energy (LCOE) fell 60% from USD 0.188/kWh to USD 0.075/kWh between 2010 and 2021 and is expected to fall further, with prices ranging from 0.10/kWh and USD 0.050/kWh by 2024.[5]The Levelised Cost of Energy (LCOE) is the cost of electricity generation over the lifetime of a power plant. It is based on a calculation of the current value of the costs of building and operating … Continue reading This makes new offshore wind plants competitive with fossil fuel generation (Figure 2).
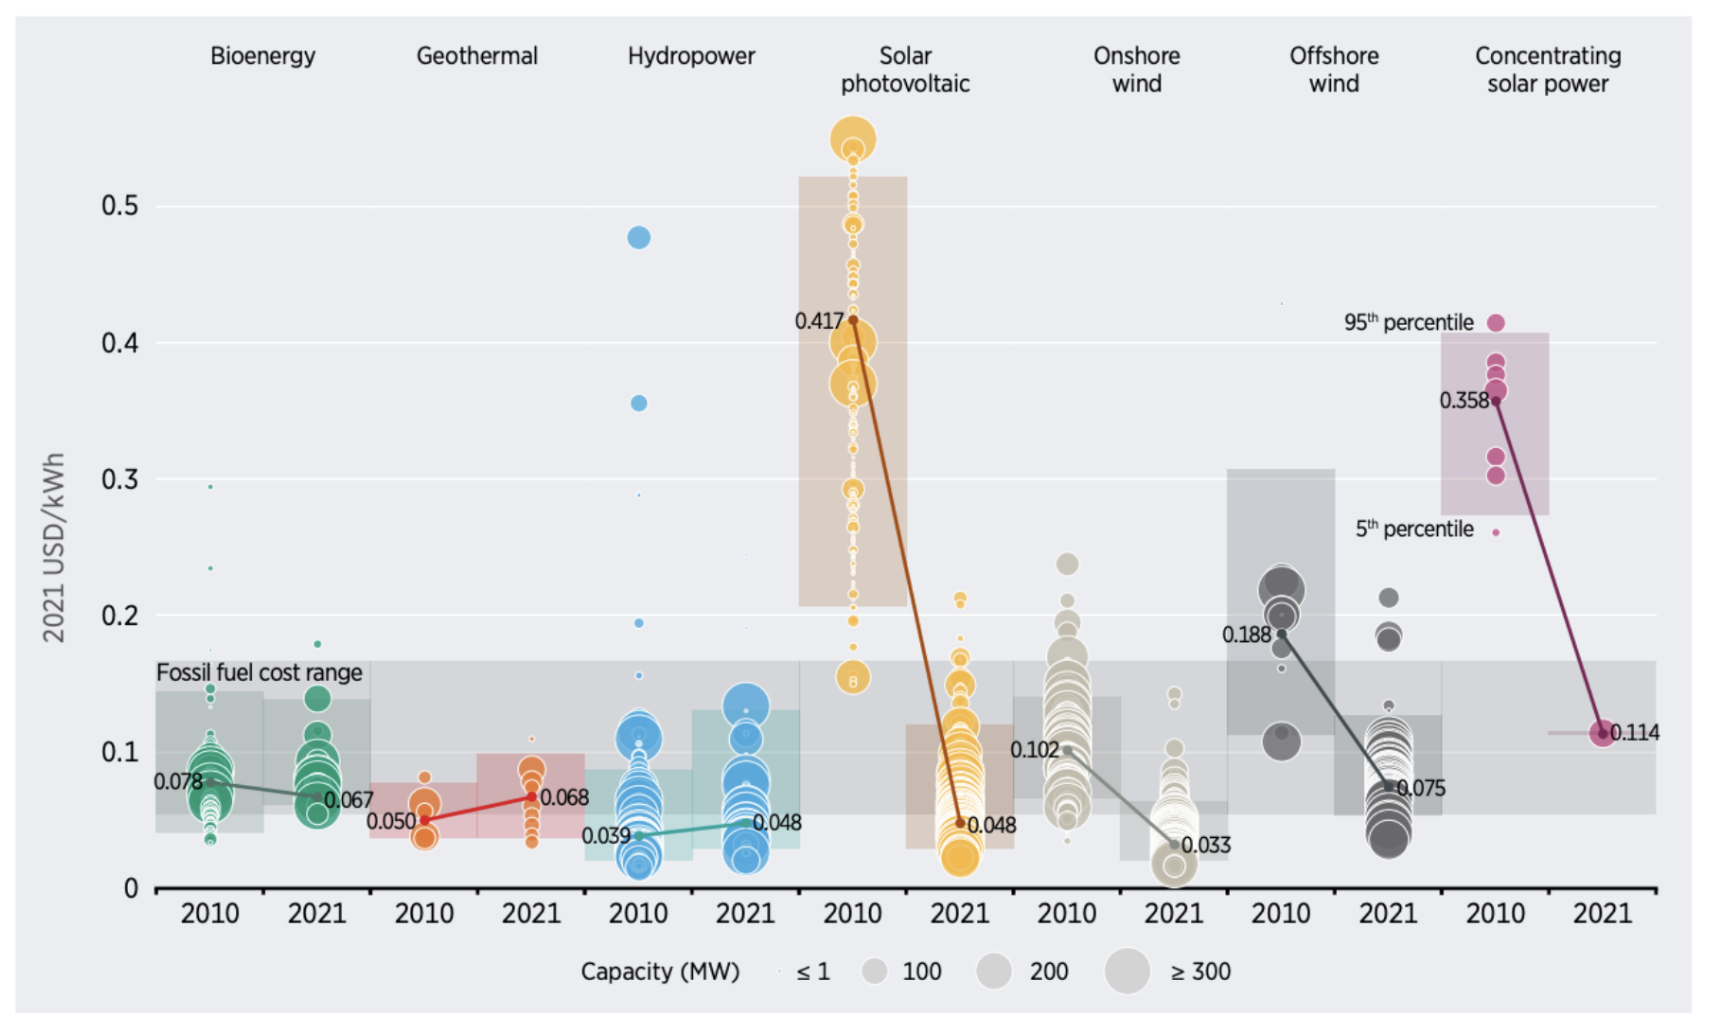
Prices for materials and freight transport have been increasing since the start of 2021 as a result of Covid impacts and increased demand. This has had a knock on impact on the costs of building new renewable projects, including offshore wind and other electricity generation projects. Despite this, the IEA finds that the increase in these costs do not negatively impact the competitiveness of wind and solar because fossil fuel and electricity prices have risen at a much higher rate.
In Japan, the government aims to reduce the price of electricity from fixed-bottom offshore wind to around USD 0.06 – 0.07/kWh (YEN 8 – 9/kWh) by 2030-35, which compares well with current prices in other countries.
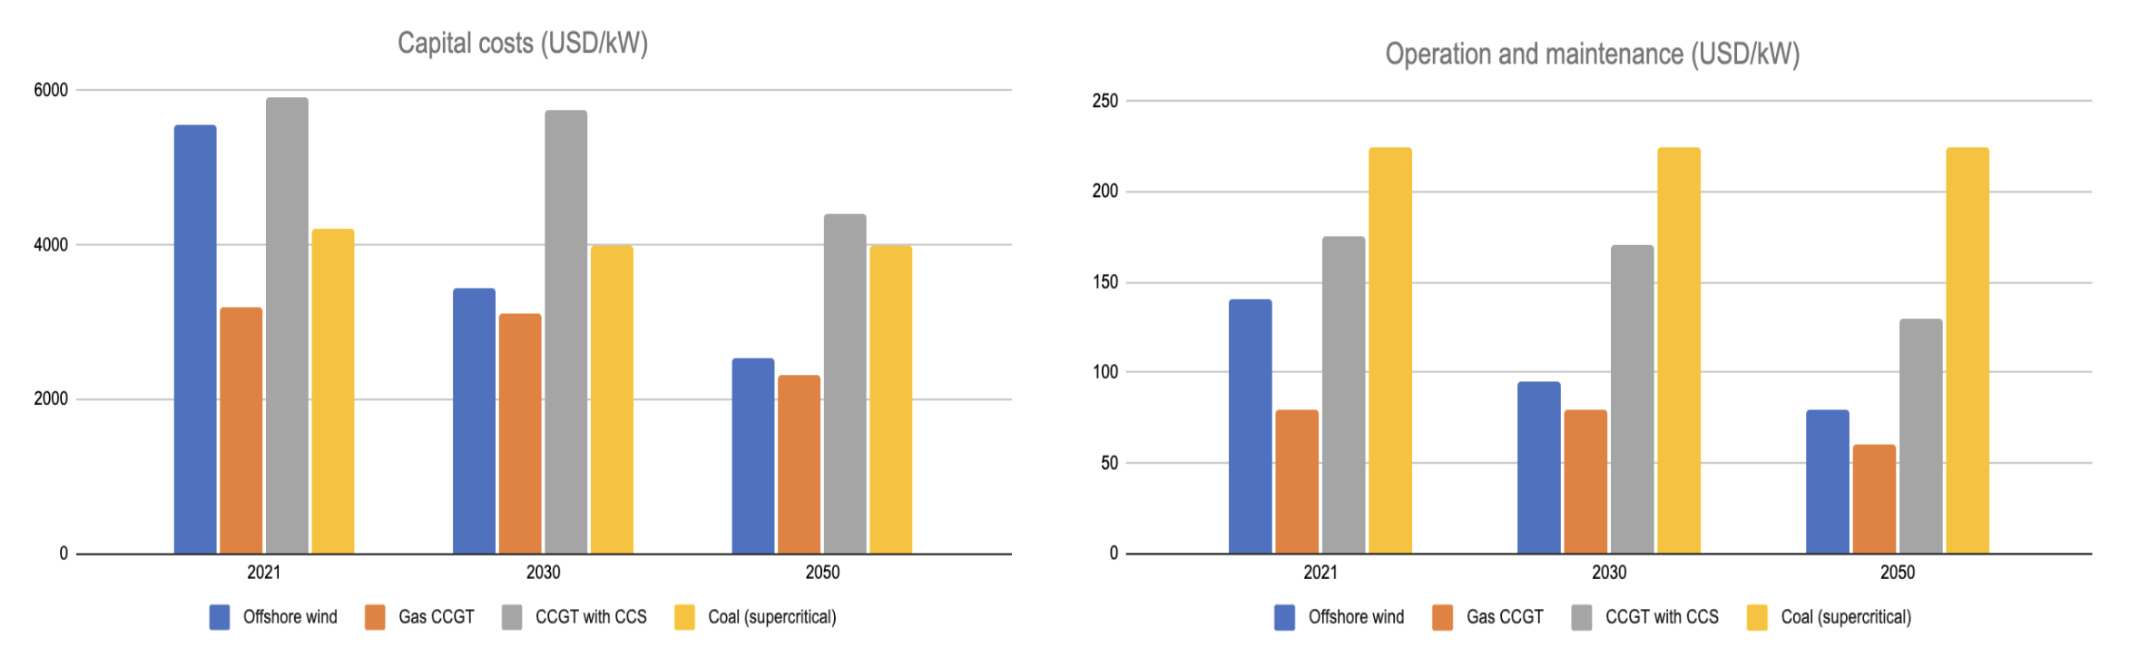
Much of this price reduction is expected to come from the reduced costs of building new offshore wind farms through economies of scale and learning effects. The IEA expects the costs of new offshore wind farms in Japan to fall rapidly by 2030 and even more by 2050 (see Fig. 3) as the country establishes supply chains and gains more experience of the technology. By 2030, it is expected to cost less to build than new nuclear power or coal with carbon capture and storage (CCS) and by 2050 to have comparable costs to coal and gas with CCS. The costs of operating and maintaining offshore wind farms also show impressive reductions thanks to a high rate of learning leading to improved performance.
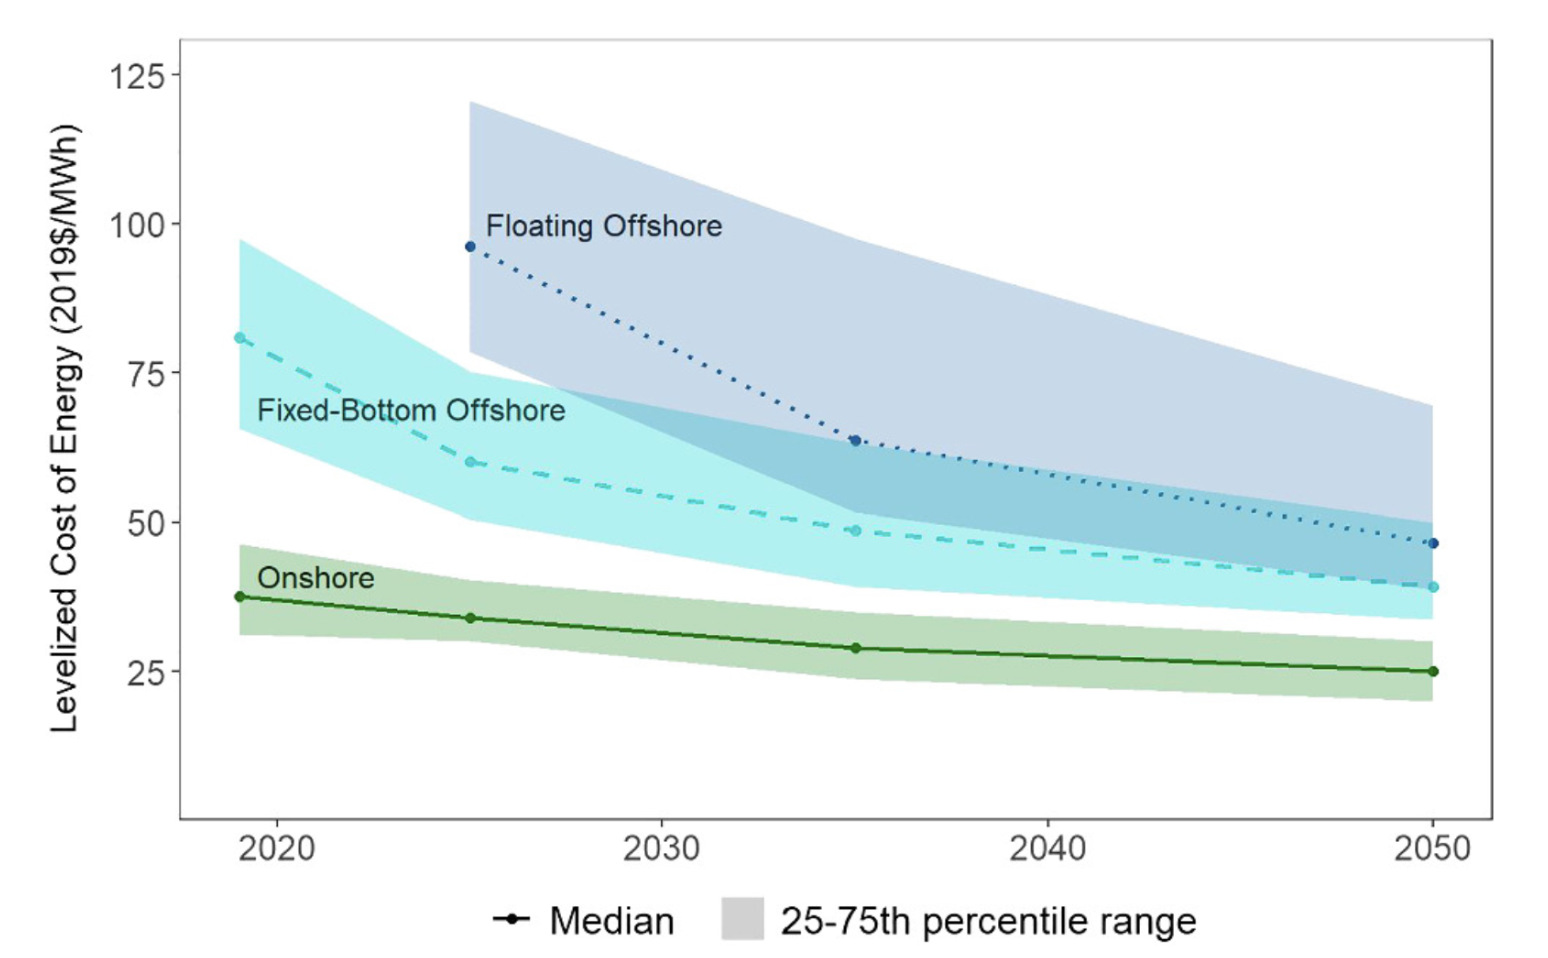
Similarly, a survey of industry experts found that the LCOE for fixed-bottom offshore wind is expected to fall by 35% from 2019 levels by 2035, and floating offshore wind to fall by 17%, largely as a result of improved performance and larger turbines leading to economies of scale. These cost reductions are expected to continue up to 2050 (see Fig. 4). A further survey of mid range forecasts for the LCOE of offshore wind in 2050 put it at around half of today’s cost (USD 40-60/MWh).[6]Beiter, P. Cooperman, A. et al (2021). Wind power costs driven by innovation and experience with further reductions on the horizon, WIREs Energy and Environment, 10:e398, doi 10.1002/wene.398.
Understanding the value of renewable energy projects also involves considering other factors. Generating electricity from domestic renewable sources reduces dependency on importing fossil fuels in an increasingly volatile global market. Japan relies on gas for about 34% of its electricity generation, and coal for around 31%. IRENA estimates that in 2022, Japan saved over USD 1 billion from displacing fossil fuel generation with renewable sources of energy added to the system in 2021 alone.
Offshore wind therefore has an important role in reducing import dependency and exposure to high fossil fuel prices. The IEA estimates that a 1 GW offshore wind farm could replace the 0.8 billion cubic meters of gas needed to generate the same amount of electricity. In 2018, the 1 GW wind farm would have reduced import fuel bills by over USD 300 million. If this is updated to 2022 prices, the 1GW wind farm would have avoided USD 928 million in imported gas costs, and the 30 GW target for 2030 would have avoided USD 27.8 billion.[7]This assumes that gas cost USD 34/MMBtu, which was the average LNG price in Asia in 2022.
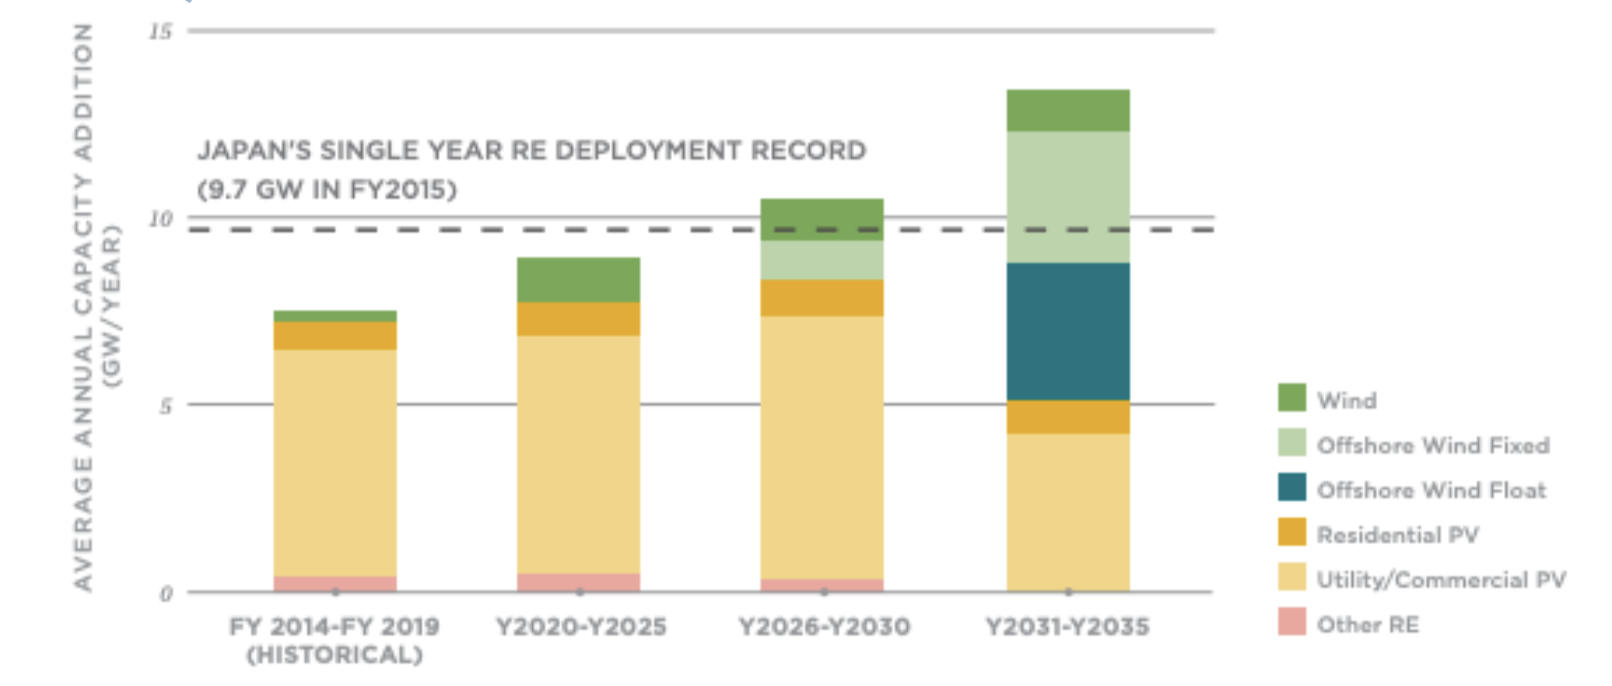
A recent study in the US projected that Japan could reduce its reliance on fossil fuels and instead generate 70% of its electricity from renewable sources by 2035.[8]The remaining 30% of electricity generation is projected to come from nuclear power (20%) and gas-fired generation (10%). Coal would be phased out by 2035 and no new fossil fuel plants would be … Continue reading This could be delivered without compromising grid security if it is complemented by increased storage capacity and improved electricity transmission infrastructure. Despite the need for investment to deliver this, the study found that average wholesale electricity costs could be 6% lower in 2035 than in 2020 because imports of fossil fuels could be reduced by 85%, and CO2 emissions for the electricity sector could decline by 92% in the same time period. While solar power is likely to make up most of the new generation in the 2020s, offshore wind is expected to dominate in the 2030s (see Fig. 5).
In addition to reduced import dependency, renewable power projects are quick to build compared with both fossil fuel power stations and new nuclear power stations. Average construction times for offshore wind farms have fallen from two years in 2010-2015 to around 18 months in 2020. This is due to a combination of experience and improved supply chains, particularly the availability of installation vessels, ensuring that new offshore wind capacity can be delivered more rapidly than conventional generation.
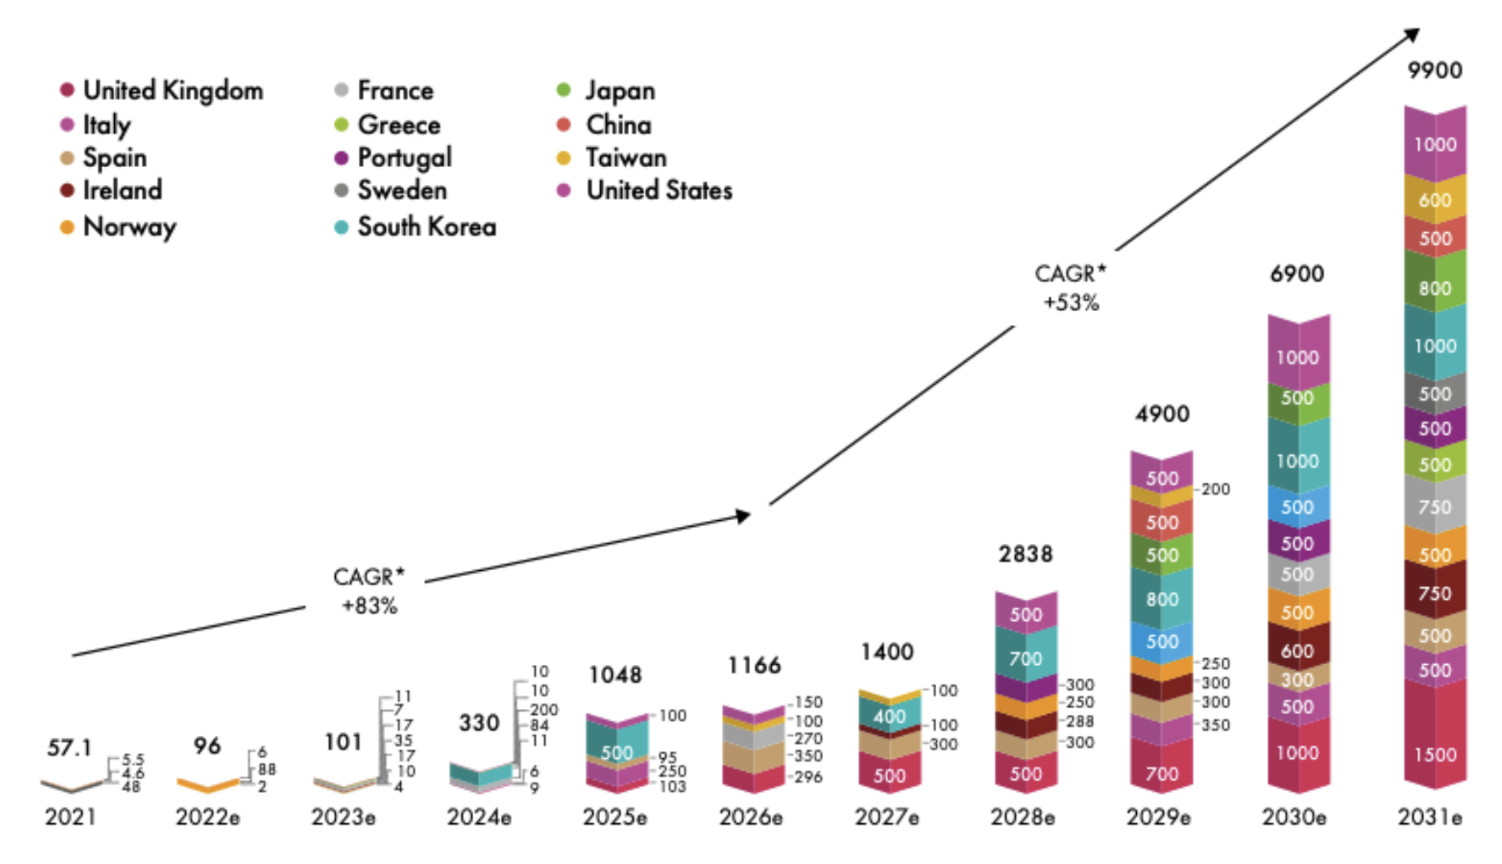
The global technical potential for offshore wind is enormous – the IEA believes that it could produce more than 420,000 TWh/year, 11 times projected global electricity demand in 2040. GWEC estimates that 80% of this potential is in water that is more than 60 metres deep, and as a result the global market for floating offshore wind will expand as countries with established industries look for new areas to develop further offshore. The floating offshore wind sector is undergoing rapid growth in Europe, with the US and Asian countries expecting to make significant contributions in the medium term (see Fig. 6).
Consultancy firm McKinsey expects that the majority of long term growth for offshore wind will be delivered by the Asia Pacific region. The region has deep seas and can be subject to extreme meteorological conditions, meaning that turbines need to be optimised for these conditions. This in turn presents commercial opportunities for countries and companies that are able to develop fixed-bottom and floating offshore wind turbines that can operate efficiently in these conditions.
The US government has recently set out comprehensive plans to drive the development of a domestic offshore wind industry to deliver decarbonisation as well as take advantage of global demand for the technology. Establishing expertise in floating offshore wind is a major focus of this initiative (see Box 2). Japan’s impressive offshore wind resource also makes it well suited to developing global leadership in the floating offshore wind sector.
The US has a huge technical potential for offshore wind. A recent government report identified 1.5 TW for fixed-bottom projects and 2.8 TW from floating offshore wind. Together they could supply three times the annual electricity consumption in the US.
The US government has recently announced plans to deliver a rapid expansion of its offshore wind industry. It currently has 42 MW of offshore wind in operation, but plans to achieve 30 GW by 2030 and 110GW by 2050.
Floating offshore wind is a key focus of this target, with the aim of making the US a global frontrunner in the technology. The Floating Offshore Wind Shot initiative focused on delivering 15 GW of floating offshore wind by 2035 and reducing the cost USD 45/MWh by 2035, a 70% reduction.
Achieving the 2030 target will mean that secure supply chains have to be established quickly to deliver the components, vessels, port facilities and workforce needed. This in turn will require significant investment to ensure the skills and infrastructure are in place. Without this investment, it is likely that delivering the 2030 target will be delayed. The government estimates that achieving this target will support 77,000 US jobs.
Despite its huge potential, offshore wind is relatively undeveloped in Japan compared to other countries.
Fixed-bottom offshore wind is now seen globally as an established technology, with secure supply chains and dominant industrial players. Floating offshore wind is still developing and therefore presents significant commercial opportunities for countries at the forefront of development. Japan’s offshore wind resource means it is ideally placed to take advantage of these opportunities.
Japan already has policy commitments to developing offshore wind technology and supply chains. The Vision for Offshore Wind set out targets of 10 GW by 2030 and 30-45 GW by 2040. These, however, are short-term targets, and will not necessarily give confidence to investors needing to recoup investments they make in establishing supply chain infrastructure or constructing offshore wind farms. The government should, therefore, develop long-term targets for both floating and fixed-bottom offshore wind as well as ensuring that carbon pricing is effective at encouraging investment in low-carbon technologies.
The country’s slow development of offshore wind to date is due to a number of factors, including perceptions of high technology risks and challenges related to permitting processes. In particular, the IEA identifies the length of the environmental permitting process and grid connection process as important barriers to faster deployment of wind.
Slow or complicated permitting processes can delay project development, or even discourage companies from participating in the market at all. Permits can involve all stages of project development, from initial site investigation to construction, and can be expensive and complex to navigate, especially if they involve multiple government departments. In particular, the Environmental Impact Assessment process in Japan has been seen as both costly and lengthy.
The government is seeking to streamline the development process for developing sites by providing a centralised service for wind resource measurements, seabed and community surveys and environmental impact assessments. It has also introduced some measures to mitigate project challenges, such as designating areas of the sea for development, and improving community engagement processes. The IEA recognises that these measures may have a positive impact on development of new projects after 2027, but the measures do not apply to those projects already in development.
Successful deployment of offshore wind relies on developing onshore grid capacity to accommodate the output. A failure to upgrade or expand the onshore network could mean that a significant amount of offshore wind potential is not used.
Historically, Japan had a very fragmented electricity network, with 10 General Electric Utilities owning and operating the distribution and transmission networks. In addition, there are two separate grids operating with different technical standards.[9]The East region grid operates at 50 Hertz, while the West region grid operates at 60 Hertz. This means that connecting the two grids is expensive and complicated. This meant that strategically planning for grid upgrades, interconnections and expansion to include more renewables generation was problematic due to the number of different interests involved.
Strategic planning is particularly important to ensure efficient investment in the new networks necessary to transmit the power from offshore to where it is needed. It can also save consumers money – a recent report by the economic consultants Brattle found that a proactive approach to transmission grid planning in the US could result in at least USD 20 billion in transmission-related cost savings, as well as reducing the number of transmission cable installations needed, thereby enhancing grid reliability and resilience and delivering savings for consumers. A similar study by the UK’s National Grid ESO also found that adopting an integrated approach from 2025 could potentially save consumers around USD 7.2 billion in capital and operating costs up to 2050, as well as delivering other benefits.
Some action to enable a strategic approach to network development has taken place. The Organization for Cross-regional Coordination of Transmission Operators (OCCTO) was established in 2015 to manage cross-regional interconnections, develop a network code for transmission and distribution and plan the development of the transmission network, as well as a range of other duties. However, if Japan is to achieve a rapid transition to a clean energy system with a thriving offshore wind industry, more needs to be done to change policies, regulations, markets and the use of land.
References
| ↑1 | Tenders (or auctions) are competitive bidding processes for fixed-price contracts for a plant’s output. Developers submit bids for the price they would like to receive for output, and the lowest priced bids are awarded contracts. |
|---|---|
| ↑2 | Mean wind power density is a measure of the wind resource. It is presented as the mean annual power per metre of the operating turbine (W/m2). The higher the density, the better the wind resource. This figure shows mean wind power density at a turbine height of 100 metres. |
| ↑3 | Technical potential is the achievable energy production of a given technology in the context of topographic, environmental and land use constraints. It does not take into account the costs of production or market issues such as investor confidence or policy and regulatory issues. |
| ↑4 | Baseload is the minimum amount of constant power required over a period of time. |
| ↑5 | The Levelised Cost of Energy (LCOE) is the cost of electricity generation over the lifetime of a power plant. It is based on a calculation of the current value of the costs of building and operating a power plant over its lifetime. It allows a comparison of the costs of different technologies even if they have different fuel costs, life spans, capacities and financial profiles. |
| ↑6 | Beiter, P. Cooperman, A. et al (2021). Wind power costs driven by innovation and experience with further reductions on the horizon, WIREs Energy and Environment, 10:e398, doi 10.1002/wene.398. |
| ↑7 | This assumes that gas cost USD 34/MMBtu, which was the average LNG price in Asia in 2022. |
| ↑8 | The remaining 30% of electricity generation is projected to come from nuclear power (20%) and gas-fired generation (10%). Coal would be phased out by 2035 and no new fossil fuel plants would be built. |
| ↑9 | The East region grid operates at 50 Hertz, while the West region grid operates at 60 Hertz. This means that connecting the two grids is expensive and complicated. |

Azerbaijan's climate and renewable energy efforts are dwarfed by its gas export expansion plans.

Although carbon capture and storage could help reduce emissions, most projects are connected to the production of more oil and…