
Key points
- Rising energy demand in emerging and developing economies (EMDEs) will be met with significant buildout of renewables, which the IEA expects to provide 42% of generation in 2030.
- This creates a significant investment opportunity in regions with high risk perceptions.
- Recent research finds that this risk may be overstated as returns outweigh modelled risks on investments in emerging markets. New GEMs data of MDB and DFI loans to private companies in EMDE regions across 2006-2025 showed a spread margin of 287 basis points (2.87%) above realised credit losses.
- All electricity projects have investment risks. However, governments – with support from MDBs and DFIs – can address these perceived risks through tools such as policy, regulation and guarantees.
- Egypt, Senegal and Nigeria are three countries where growing demand for solar and wind power and government regulatory measures align to create an enabling investment environment.
- India’s enabling environment (at the federal level) offers an example of how such measures can attract significant investment.
Growth in renewable energy is creating investment opportunities in emerging markets
The International Energy Agency (IEA) predicts that the renewable share of power generation in 2030 for emerging and developing countries (EMDEs) will reach 42%, representing an additional 3,251 GW in the base case. In the accelerated case, net renewable additions are expected to exceed 4,000 GW. For context, global installed electricity capacity across all sources stood at 10,195 GW in 2025.
The IEA has forecast that annual grid infrastructure investment of USD 300 billion per year in EMDEs will be necessary to support rising power demand and renewable energy additions.
If current trends continue, capital expenditure for solar and onshore wind projects for emerging and developing countries, as defined by the IMF, is projected to reach USD 356 billion by 2040, according to Rystad data (figure 1).1Rystad has country-level projections through 2040 for solar and onshore wind projects and associated CAPEX. We have filtered these for countries defined by the IMF as emerging and low-income developing countries.
Figure 1
High cost of capital presents a challenge to investors, but is it overpriced?
This growth represents a significant opportunity in solar and wind projects in EMDEs. However, the high cost of capital – the minimum required rate of return investors seek for a project – continues to impede progress in the sector’s development. This slows the energy transition in many EMDE markets.
The environment in which a project is developed and operated has a direct impact on how risky an investment is perceived to be. Investment risk is reflected in the weighted average cost of capital (WACC), or the cost of servicing debt and equity. According to the IEA, the average WACC for large solar PV projects in major EMDE countries was up to double that of advanced economies in 2015-2024.2The IEA has defined ‘major’ EMDEs as India, Brazil, South Africa, Indonesia and Mexico.
Credit risk, defined as the probability that a borrower could default on a loan, is a key driver of the high cost of capital for renewable projects in emerging and developing countries.
Data shows that perceived credit risk in emerging markets is often overstated
A lack of data often results in a credit risk premium for emerging markets. According to a 2025 OECD analysis of African capital markets, 80% of rated African countries are classified as high risk or very high risk. Perceived credit risk in emerging markets is often higher than recent data suggests is reflected in reality.
The Global Emerging Markets Risk Database (GEMs), created by the European Investment Bank (EIB) and the International Finance Corporation (IFC), aims to mitigate this risk, drawing on over 30 years of data from multilateral development banks (MDBs) and development finance institutions (DFIs) loans to emerging market countries.
New GEMs data covering private sector lending by MDBs and DFIs in emerging markets, show that loans made during 2006-2025 had an average total spread of 377 basis points (3.77%). Total spread represents the margin demanded by lenders to compensate for underlying credit default risk, construction, country and political risk, etc.
Over the same period, the average realised loss rate was much lower at 90 basis points (0.9%).3Global Emerging Markets Risk Database, Default and Recovery Statistics: Private Lending 1994-2025, page 4. This leaves an ex-post spread margin of 287 basis points. The gap suggests that interest spreads have historically provided a cushion against losses, implying that market-perceived risk in emerging market private debt may run higher than actual risk. That is, the risk investors expect is higher than the risk they are taking (figure 2).
Figure 2
When looking at loans to private entities in emerging markets, GEMs found that the likelihood of default was similar to advanced economies, and the likelihood of recovery was higher than expected.
For renewable energy projects specifically, MDB and DFI loans to more than 804 private entities in 159 countries between 1994 and 2025 had an average default rate of 2.61% – similar to default rates of private firms in advanced economies.4Global Emerging Markets Risk Database, Default and Recovery Statistics: Private Lending 1994-2025, Table 11: Default Rates by GEMs Sector Grouping, page 16, accessed 19/10/2026. MDB and DFI lending to public entities was not included due to the low number of counterparties.
Loans to private entities in EMDE markets for renewable energy projects also showed strong recovery performance at 71.8%, meaning that even when a default occurred, MDB and DFI lenders recover the vast majority of their capital.5Global Emerging Markets Risk Database, Default and Recovery Statistics: Private Lending 1994-2025, Table 59: Recovery Rates by GEMs Sector Grouping, page 99. The recovery rate is the ratio between the discounted cash flows received (or expected to be received) after a set discount date (for example, default date) and the outstanding amount at that time.
By region, default rates for renewable projects were lowest in the Middle East and North Africa at 0.17%,6Global Emerging Markets Risk Database, Default and Recovery Statistics: Private Lending 1994-2025, Table 16: Average Default Rates and 90% Confidence Intervals by World Bank Region and GEMs Sector, page 20. while the recovery rate in Sub-Saharan Africa was highest of all EMDE regions at 87.5%.7Global Emerging Markets Risk Database, Default and Recovery Statistics: Private Lending 1994-2025, Table 64: Recovery Rates by World Bank Region and GEMs Sector Grouping, page 105.
A Moody’s assessment of green use-of-proceeds loans in different economic development categories showed that EMDE countries performed just under advanced economies in terms of recovery rates. A smaller group of EMDE countries that excludes those in the EEA or OECD had a lower default rate on green loans compared to advanced economies (figure 3).
Figure 3
Other research supports these findings. A survey of 116 active public (30%) and private (70%) investors from local African entities, the European private sector, multilateral organisations and international DFIs revealed that risk perception of renewable projects in six Sub-Saharan African countries was relatively low.8Of the six countries studied, Côte d’Ivoire, Senegal and Kenya were ranked the most attractive markets, while Ghana, Ethiopia and Mozambique were seen as broadly low risk with certain areas in need of policy support. The top three risks identified by investors in the survey were political risks, market transparency and offtaker risk.
One aspect of market transparency that is being addressed is country credit risk. A new African credit rating agency launched on October 7, 2026 in Mauritius to increase information transparency on creditworthiness in African nations, drawing from local expertise. This is expected to serve as a counterweight to the ratings of the three global agencies, which have historically lacked sufficient data on African markets.
Some countries have introduced policies to limit renewable project risk
Perceived and actual investment risks can be mitigated in part through measures taken by national governments and supported by multilateral finance organisations.
Policy and regulatory action can act as mitigants for many of the risks associated with renewable projects. The Energy Sector Management Assistance Programme (ESMAP), part of the World Bank Group, outlines these as including land acquisition, permitting, construction costs, stability of energy prices and foreign-exchange risk (Figure 4). Actions taken to create an ‘enabling environment’ for investment can include legislation, policy or regulation to ensure access to land; transparent procurement processes and regulation; certainty that the project will be connected to the grid; firm power purchase contracts, often in hard currency; and a degree of confidence that these arrangements will endure for the lifetime of the project through long-term policy targets or legislation.
Figure 4
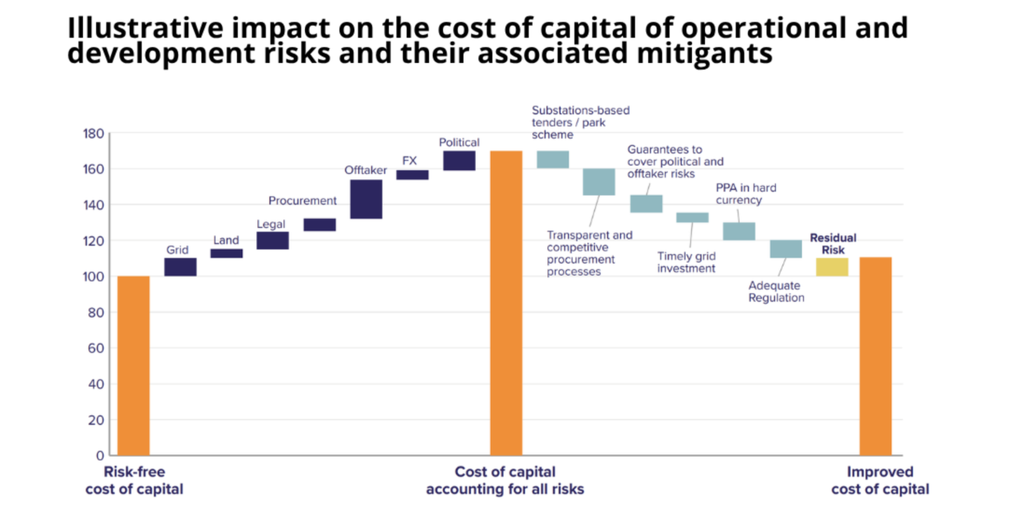
Source: ESMAP. 2023. How to Unlock Pipelines of Bankable Renewable Energy Projects in Emerging Markets and Developing Countries? © World Bank.
Learning from the Indian experience
In many ways, India can be seen as a role model in developing its renewable energy sector. The country has taken a holistic approach to encouraging investment by addressing development, construction and market risks with policy and regulatory mechanisms, and now ranks third for global installed capacity of renewables.
As with many other countries, renewables development has in the past been inhibited by land disputes, delays in payments to generators from distribution companies paying for generation and a lack of transmission capacity delaying connection.
In response, the Indian government put together a package of measures designed to address these problems and others, to build investor confidence (Box 1).
Box 1: A renewables powerhouse built on enabling policies
India’s drive for renewables investment has resulted in a mosaic of legislation, policy and regulation designed to address the investment risks for renewables. These include
Long-term targets
- A clear national target for 500 GW of non-fossil fuel capacity by 2030 provides clarity for ambition. India reached 500 GW in total grid capacity in 2025 and met its NDC goal of 50% non-fossil capacity five years early. Planning is now targeting about 60% non-fossil capacity by 2035. The government has also issued a bidding trajectory of 50 GW of renewable capacity a year through FY 2028, ensuring clear procurement visibility for developers.
Easing investment
- Designated Ultra Mega Renewable Energy Parks (UMREPPs) provide land and access to transmission (‘plug and play’). UMREPPs are large-scale, concentrated generating zones for renewables development, generally with capacity over 500 MW. The UMREPP scheme is meant to deliver 40 GW of capacity by 2026.
- The government also allows up to 100% foreign direct investment in the electricity sector.
Subsidies
- A range of capital and interest subsidies are available for different technologies. This includes up to INR 25 lakh (USD 26,000) for solar parks and Ultra-Mega Projects in the initial development stages and INR 20 lakh/MW (USD 21,000) or 30% of the project cost to contribute to transmission and shared infrastructure costs.
- The Viability Gap Funding (VGF) scheme provides grants for public-private partnership projects using technologies which were not commercially viable but seen as economically or socially desirable. The construction of India’s first offshore wind farms received VGF funding in 2024, including the upgrade of two ports to provide logistical support.
- A 25-year waiver on inter-state transmission charges is available for wind, solar and hybrid projects for projects in UMREPPs commissioned before 2025, and a phased introduction of transmission charges up to 2028.
Guarantees and market access
- Guaranteed offtake is mandated through the Renewable Consumption Obligation (RCO) applied to distribution companies, large industrial and commercial consumers and some other consumers. It requires them to take a certain proportion of their power from renewable sources, with the specified proportion increasing each year, creating an expanding market for renewables output.
- Increasing wholesale market access through renewable power exchanges, including a day-ahead and intra-day market ease sales transactions.
- The government introduced rules to prevent late payment for power by distribution companies in 2022 after distribution companies have struggled in the past to pay generators for output. Arrears have since fallen from INR 1,39,947 crore (USD 14.8 billion) in 2022 to INR 4,109 crore (USD 433 million) in February 2026. Details of distribution company arrears are published by the government.
India has achieved impressive growth in its renewables capacity and generation. Wind and solar capacity has grown on average by over 20% a year since 2020, driven largely by solar expansion. Much of the early policy activity concentrated on driving new solar capacity, which has expanded from 0.09 GW in 2010 to over 190 GW in 2025, according to Rystad data.9Rystad Power Macro Analysis, accessed on 20 October 2026. Wind expansion showed steady growth, but the rate of deployment appears to have increased in 2024/25 to over 13%, perhaps as a response to the creation of UMREPPS and the introduction of the RCO in the preceding years (figure 5).
Figure 5
Egypt, Nigeria and Senegal provide examples of demand growth giving rise to an incentive to create enabling environments for renewables
The demand for electricity is expected to surge across Africa, including in each of our three case study countries: Egypt, Nigeria and Senegal. Egypt’s demand is projected to increase 21% from 182 TWh in 2025 to 220.7 TWh in 2030, with a 4-5% annual growth rate up to 2050. Nigeria’s demand is expected to grow 36% from 33.7 TWh in 2025 to 45.9 TWh in 2030, followed by annual growth of 8-9%for the next two decades. Senegal is expected to see demand increase by 32% from 7.6 TWh to 10 TWh between 2025 and 2030, with a 6-7% annual growth rate to mid-century (Figure 6).
Figure 6
All three countries are committed to growing their renewable energy sectors in response to rising electricity demand and to meet decarbonisation targets. To this end, the governments are enacting measures explicitly designed to lower the cost of capital of renewable projects by reducing real or perceived risks of investing in renewable electricity projects. We’ve tracked targets, policies and regulations, and investment incentives as non-exhaustive examples of the ways in which these countries are creating a more enabling environment for foreign investment into solar and wind projects.
Egypt: Increased market liberalisation supports renewables growth
Egypt updated its renewables target in August 2026 to 45% of generation by 2028, up from the 42% of generation by 2030 put forward in its Nationally Determined Contribution (NDC). A longer-term target of 61.2% by 2040 was announced in September 2026 as part of an effort to improve electricity system security and build local manufacturing expertise in renewable and storage technologies. These expansion plans are accompanied by projects geared towards strengthening the country’s grid.
The country’s electricity industry is largely government-owned, but is increasingly open to independent power producers and has a clearly defined process for encouraging renewables investment. The sector is governed by the 2015 Electricity Law, which started the process of liberalising the electricity market. This is supplemented by the 2014 Renewable Energy Law, which established feed-in tariffs and competitive tenders for long-term, fixed-rate contracts offered by the Egyptian Electricity Transmission Company (EETC).
Private-to-private (P2P) electricity contracts were introduced in 2024, representing a significant step towards the liberalisation of the sector set out in the 2015 law. The regulator, EgyptEra, offers standardised contracts for renewables projects, enhancing certainty around project planning. The first four P2P contracts were agreed in 2025, with technical support from the European Bank of Reconstruction and Development.
Investment incentives have been developed to support the liberalisation agenda set out in the policy framework. The Investment Law 2017 offers 30% tax deductions for eligible investment costs for renewable projects, or 50% for projects in areas most in need of development. It also streamlines the permitting process for renewable projects, as well as granting other incentives (a measure known as the Golden Licence). In addition, the New and Renewable Energy Agency (NREA) provides access to government-owned land to project developers.
Egypt aims to become a regional hub for electricity trading with strong interconnections to neighbouring countries. It is also developing plans for interconnectors with Greece and Italy to export renewable power to Europe. This will help generators find a market for their power at times of surplus generation.
Nigeria: Ambitious plans to increase energy access through mini-grids
Nigeria has a long-standing target for renewables to provide 30% of electricity capacity by 2030. The Nigeria Industrial Revolution Plan (NIRP) adds an additional target of 55% by 2050. More recently, Nigeria has aligned its third Nationally Determined Contribution (NDC) with the World Bank’s Mission 300 Compact, committing to a target of 50% renewable generation by 2030. The long-term Energy Transition Plan (ETP) targets 82% of capacity provided by renewables by 2050. The National Integrated Electricity Policy has specific targets for individual technologies by 2060, including 15 GW of concentrated solar power, 45 GW of solar PV and 25 GW of wind.
Nigeria’s recent energy policy has focused on reforming the electricity sector to encourage private investment. The Power Sector Recovery Programme was published in 2018 and set out reforms to run up to 2021 designed to improve the reliability of the electricity industry and strengthen governance arrangements to encourage greater investment and increase energy access.
This was followed by the 2023 Electricity Act, which provides the legal framework underpinning the electricity sector. The Act has the authority to require large consumers to buy a certain amount of their power from renewable sources. It also establishes a feed-in tariff for up to 20 years and sets out a clear framework for connecting renewables projects to the grid. The Act aims to encourage the decentralisation of the electricity system to enable quicker connections in rural areas by allowing state-level regulation and market design.
The national electricity supply industry is regulated by the independent Nigerian Electricity Regulatory Commission (NERC), with state-level regulatory commissions working within its framework. NERC is responsible for promoting renewables, distributed (embedded) generation and mini-grids, as well as overseeing the smooth operation of the electricity market. It has been proactive in trying to increase renewables generation. In 2024, NERC required all distribution companies to buy 10% of their power from embedded sources, with at least 50% of that from renewable sources. NERC rules for mini-grids have been recognised as “one of the region’s most progressive and comprehensive sets of mini grid regulations” by the World Bank.
The electricity market is administered by Nigerian Bulk Electricity Trading (NBET). NBET offers standardised PPAs for utility-scale solar, while NERC has set up standardised procedures for permitting and operating mini-grids.
In addition, the government set up tax incentives under the Nigeria Tax Act 2025 to encourage investment in renewables by suspending VAT on renewable energy equipment. In 2026 it introduced the Economic Development Tax incentive, a 5% annual tax credit on eligible investment over five years for electricity generators, including renewables. The tax credit can be extended for a further five years if the company reinvests its profits into the business. In addition, the Act creates a 5% surcharge on fossil fuels, further supporting the competitiveness of renewable energy in the market.
Nigeria also introduced foreign-exchange reforms in 2023, alongside other fiscal reforms, leading to an upgrade in the country’s credit rating. Foreign investment drove a nearly 90% rise in capital inflows in 2025 as a result of the reforms, while foreign direct investment rose from USD 675 million in 2024 to USD 923 million in 2025.
Senegal: Private participation drives electricity growth within a framework of supportive policies and investment plans
Senegal’s electricity demand is increasing rapidly, driven by economic growth and the government’s target of achieving universal access by 2029. Even so, demand has sometimes outstripped projections, leading to load shedding.
While the national operator SENELEC’s generation remains static, the independent power producer (IPP) sector is growing rapidly, with generation increasing more than 11% between 2023 and 2024. The Just Energy Transition Partnership (JETP), agreed in 2023, sets a target of 40% renewables capacity by 2030, with the JETP Investment Plan setting an interim target of 36.1% by 2029. Longer-term targets are not yet fully defined, although the National Transformation Agenda, known as Senegal 2050, projects that more than 40% of new capacity will come from renewables by 2050 (around 4 GW).
The Electricity Code 2021 sets the framework for ownership and operation of the electricity system, expanding the liberalisation of generation, distribution and supply. It puts in place the framework for paying IPPs, with contracts by the industry regulator, the CRSE, after a tender process set out in a separate decree. In addition, network operators are required to prioritise the connection and dispatch of renewable projects.
Much of the land in Senegal is communally owned, known as the national domain. Because developers are likely to view community land rights as a project risk, the government has changed the status of land for individual projects from national domain to state domain, allowing the state to lease the site to the developer.
Senegal uses the West African CFA franc which is pegged to the euro. This can help limit inflation rates compared with some other African countries with floating currencies, and removes exchange-rate risk for international investors. France also guarantees unlimited convertibility of the CFA into euros, reducing the risk of balance-of-payments crises or foreign-currency depletion.
Senegal launched the Renewable Energy and Energy Efficiency Fund (REEF) in 2025 as a financial vehicle to stimulate private sector investment in sustainable energy. REEF is part of Senegal’s JETP and aims to mobilise EUR 2.5 billion in financing to achieve the JETP goal of 40% renewables by 2030.
Public institutions are incentivising private investors to develop renewable projects through blended finance initiatives
All three countries have made meaningful efforts to address the risks identified by ESMAP by establishing clear policy and legislative frameworks and putting measures in place to mitigate uncertainties associated with construction and offtake. Private investors are already taking advantage of the opportunities which are opening up, often in concert with public financing vehicles which further reduce risk.
Alongside government-led efforts to create enabling environments for renewables investment, public sector institutions de-risk opportunities and catalyse private participation through investment structures such as blended finance. These financing models provide credit guarantees for private investors for projects by redistributing risk toward MDB and DFIs away from host governments. This lowers the perceived investment risk of renewable projects for private investors.
The private sector has built more than 70% of Egypt’s solar and wind capacity – 2.9 GW of solar and more than 1.6 GW of onshore wind, with more in the pipeline. Many early projects received financial support from MDBs and DFIs, most recently a USD 265 million concessional loan arranged by the European Bank for Reconstruction and Development in October 2026 with participation from other European DFIs and blended finance vehicle Climate Investment Funds for a large-scale solar and storage project.
Nigeria became Africa’s second-largest solar market in 2025, installing over 800 MW, and new blended-finance vehicles such as the Distributed Renewable Energy Fund are seeking to mobilise further private and institutional capital. Senegal has attracted more than USD 500 million for solar and wind projects since the mid 2010s including over USD 126 million in private equity.
Climate finance is not a one-size-fits-all solution. For instance, for our case study countries, India’s renewable financing is heavily domestic, while Egypt, Senegal and Nigeria rely more on MDBs and DFIs. With official development assistance budgets shrinking, the New Collective Quantified Goal (NCQG) positions blended finance as a bridge.
A number of successful examples exist. India launched the USD 944.5 million Green Growth Fund in 2021 to support renewables development by combining public equity with concessional capital. It has been successful in crowding in global pension and sovereign wealth funds, enabling risk sharing across utility-scale solar and wind projects, though its reach remains limited.
Another example is the pilot phase of Nigeria’s Green Finance and Investment Facility, a USD 188 million blended-finance platform designed to accelerate the deployment of 40 interconnected mini-grids.
Also in Nigeria, the World Bank’s USD 750 million Distributed Access through Renewable Energy Scale-up (DARES) programme builds on the regulatory support for mini-grids. DARES is the first joint World Bank effort to create a private sector-led electrification programme by using innovative financial and de-risking instruments to encourage private investment and expand energy access using renewable power.
The DARES programme focuses on result-based financing such as performance-based grants for policymakers and developers to offset the high capital costs of projects, as well as other measures, such as credit guarantees, dedicated blended debt vehicles like such as the Green Finance and Investment Facility, and foreign-exchange volatility through local currency guarantees and other mechanisms. DARES also enables standardised power-purchase agreements (PPAs) and revenue derisking by subsidising load centres to increase daytime demand and achieve predictable off-take.

